Spatial Statistics
Investigating AFM Images
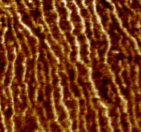
Here is an example of an AFM images with highly aligned fibers:
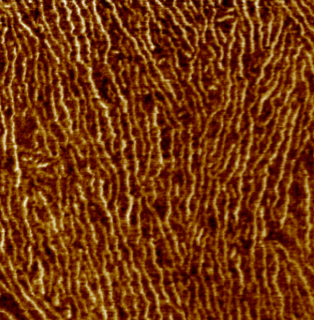
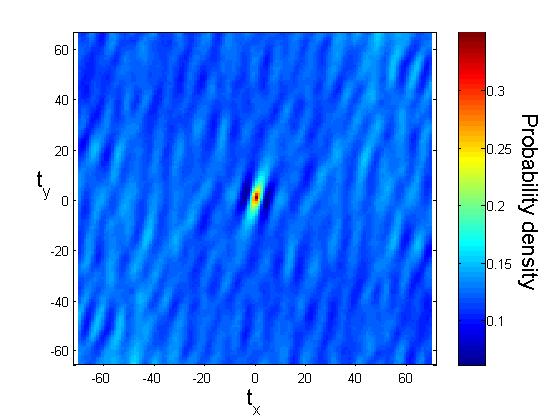
We have applied the SpatialStatsFFt Matlab function to this image and obtained the following spatial statistics:
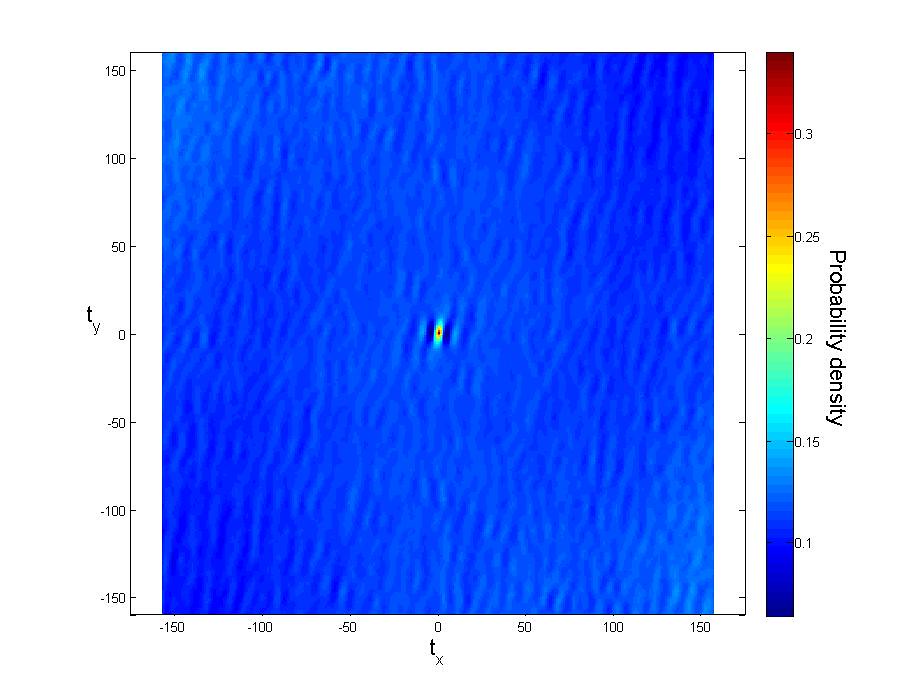
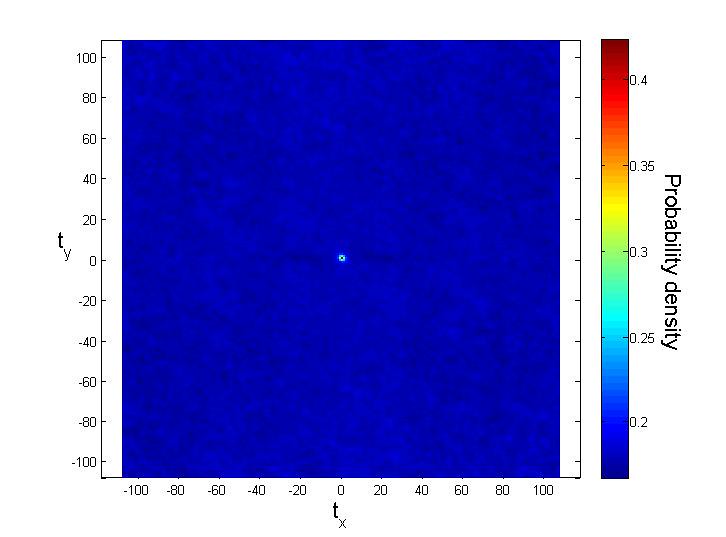
Although the plotted spatial statistics contains little infomation about the image, the difference in the spatial statistics is apparent compared to the statistics of an AFM image with few fibers.
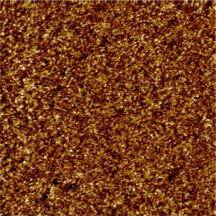
AFM Image with little to no fibers
SpatialStatsFFt of the Above AFM Image
SpatialStatsFFt of Image Sections
To better utalize the SpatialStatsFFt functions, we calculated statistis for small sections of the AFM image.
Section of AFM Image
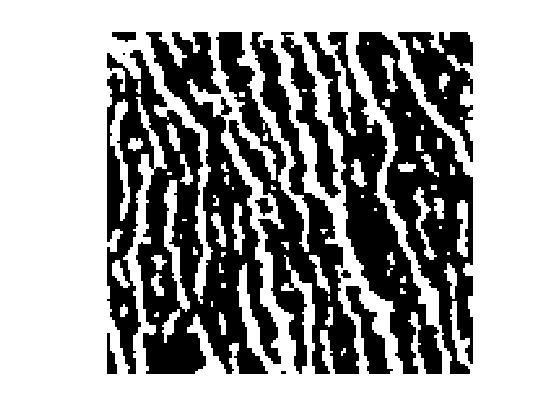
Black and White Threshold Representation of Image
SpatialStatsFFt of Section of AFM Image
Understanding SpatialStatsFFt
To verify our understanding of SpatialStatsFFt, we wrote a short matlab script to calcualte specified values of the probablitiy density matrix.